
Nadira, a HGAED geographer, is interested in the impact of gentrification on local communities. Her research explores the relationship between gentrification, crime and the built environment.
The following is an extract from Nadira's essay title:
'Has gentrification improved crime and the built environment'?
Introduction
Gentrification was first defined by sociologist Ruth Glass in 1964; she used it to describe how working-class families were displaced by the middle and upper classes, to the degree that the “social character of [a] district was changed”. This controversial change often starts as one that will benefit past residents and improve lacking aspects of an area (e.g. education and crime), but eventually ends up benefitting middle and upper-class society. Over the last two decades gentrification has become more prominent in stereotypically deprived and old industrial areas across England; such as Sheffield, Liverpool and more recently Manchester. Alongside this, gentrification has also slowly started to occur in areas within London. I chose Peckham as the site of my research because of its unusual gentrification that began in the millennium with the construction of Peckham library, and was ‘in stasis’ for a more than a decade before the construction of the overground line in 2011, which linked South London to Central and East London. The awkward timeline of this gentrification has led to stark contrasts between newly gentrified areas and older businesses. The purpose of my research is to discover how successful the gentrification of Peckham has been in terms of socio-economic factors such as crime and safety and built environment, and how this in turn has led to spatial inequalities within the area. This research is relevant because it brings another perspective to the debate that gentrification is a solely positive change. I chose the research sites below because they are all currently experiencing some stage of gentrification and are formed of the three electoral wards that create Peckham; Peckham, Lane, and Peckham Rye.
Aims
The main aim of this investigation is to discover if the past and on-going gentrification of Peckham has been successful in terms of its built environment, and safety. Another aim of this investigation is to explore how gentrification has affected socio-economic inequalities in the area, mainly in quality of housing and incidences of crime. As gentrification is often seen as change that will increase both standard of living and quality of life, I plan to assess how successful the gentrification of Peckham has been in doing this with variations of the environmental quality survey e.g. building decay survey and secondary data. I also want to find out who the main stakeholders have been (e.g. the government or private organisations) and who has benefitted the most; long term residents or visitors and newer occupants. I understand however that this research is a small section in the wider topic of cycles of affluence and deprivation in urban areas and any results I get will not be 100% confident due to time restrictions. Therefore, I have split the main question into two more manageable sub-questions, which are easier to research and prove.
Sub-Questions
1. Has the gentrification of Peckham led to improvements in the built environment?
2. Has the gentrification of Peckham led to improvements in crime and social inequalities?
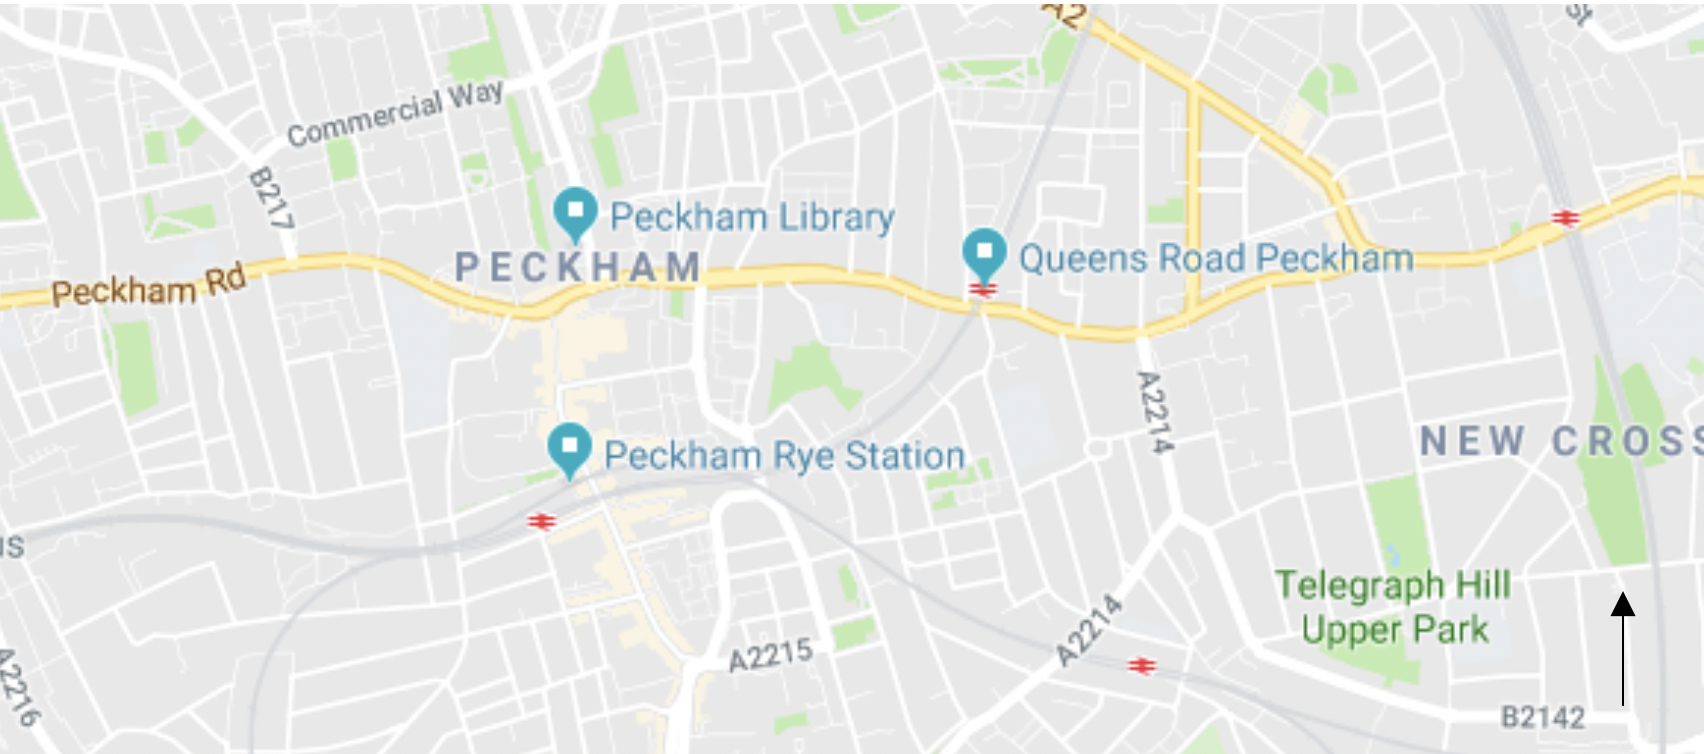
Site 1-Peckham Library
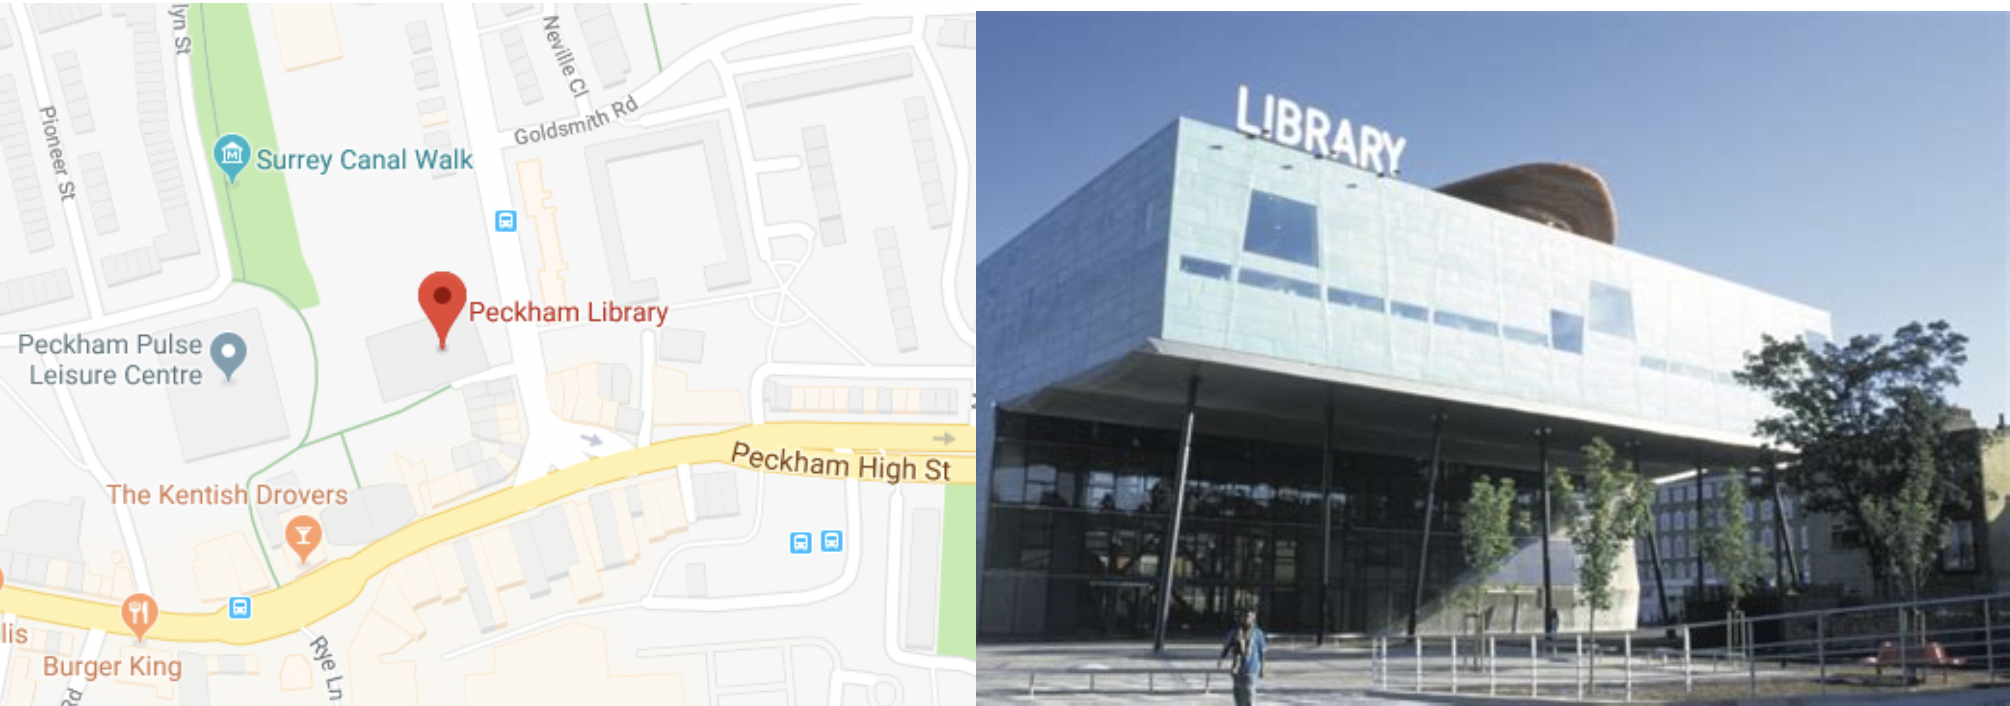
Peckham Library is both a community building and a library, created in the summer of 2000 by Alsop and Stormer. It won the Stirling Prize in architecture for its abstract shape and creative approach to limiting street noise. In the year of its opening alone it attracted 500,000 visitors and was a ‘springboard’ for the beginning of gentrification in the area. Before the construction of Peckham library, residents had to travel over 20 minutes from Peckham High Street to any library, so it created a space for local students to learn, and even offered annual revision programmes in the spring to assist students. Funded by the EU, Peckham Library was the first foothold of gentrification in Peckham. I used this as a research site as it marks the beginning of gentrification in Peckham, despite the lack of gentrification in the surrounding vicinity. This site shows how gentrification can be a location specific process, encircled by areas in decline.
Peckham Library is both a community building and a library, created in the summer of 2000 by Alsop and Stormer. It won the Stirling Prize in architecture for its abstract shape and creative approach to limiting street noise. In the year of its opening alone it attracted 500,000 visitors and was a ‘springboard’ for the beginning of gentrification in the area. Before the construction of Peckham library, residents had to travel over 20 minutes from Peckham High Street to any library, so it created a space for local students to learn, and even offered annual revision programmes in the spring to assist students. Funded by the EU, Peckham Library was the first foothold of gentrification in Peckham. I used this as a research site as it marks the beginning of gentrification in Peckham, despite the lack of gentrification in the surrounding vicinity. This site shows how gentrification can be a location specific process, encircled by areas in decline.
Site 2-Peckham Rye Station
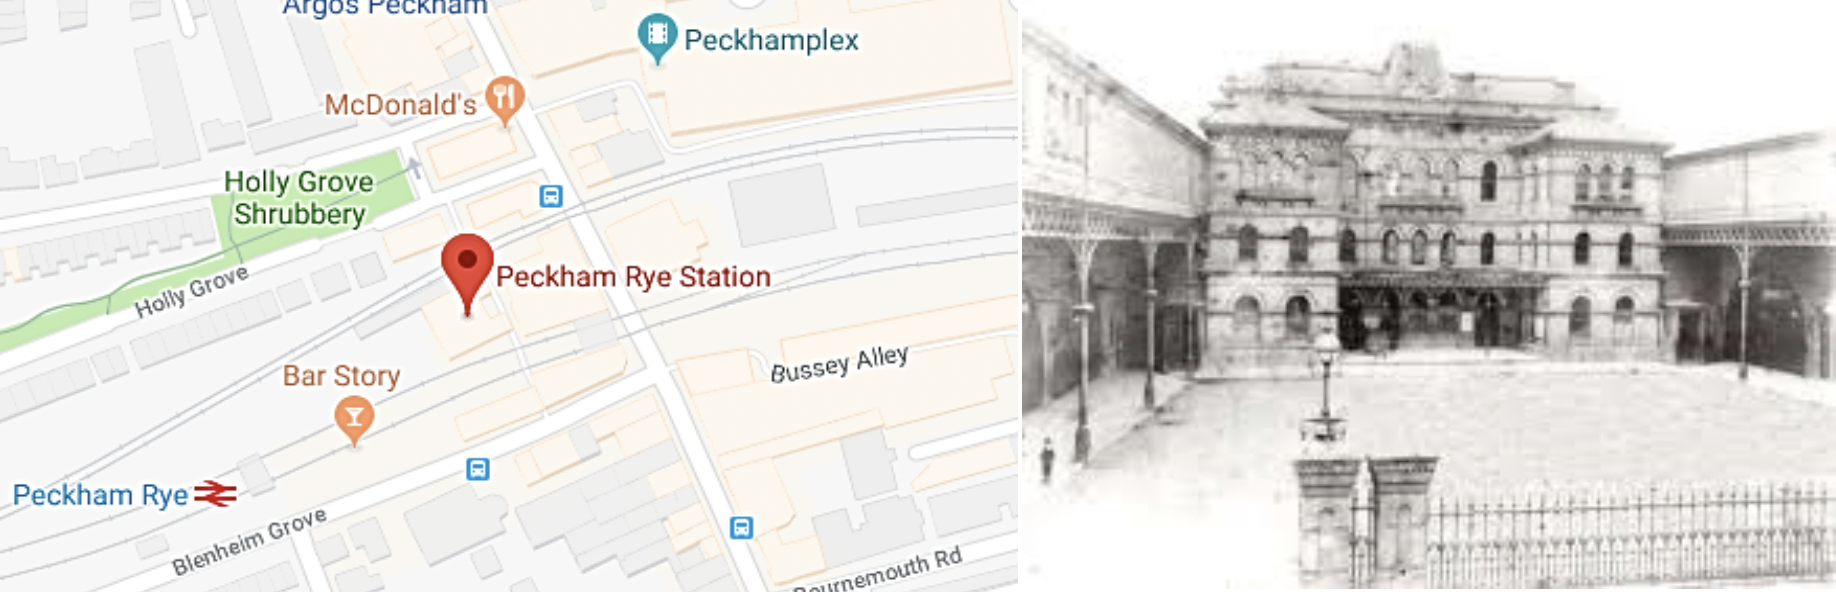
Peckham Rye Station was opened in the centre of the Peckham shopping district in 1865 by Charles Henry Driver. Since its opening, Peckham station has become a key interchange in train services as both the East London and the Thameslink services serve it. Apart from minor renovations and restorations the actual building had never been altered, becoming a protected heritage site. However, because of the unprecedented popularity of the Thameslink and East London Services the station could not cope with the daily influx of passengers and is now scheduled for regeneration in 2019. I chose this site for my research because it is a location intrinsic to Peckham, used by hundreds daily on their journeys to and from work.
Peckham Rye Station was opened in the centre of the Peckham shopping district in 1865 by Charles Henry Driver. Since its opening, Peckham station has become a key interchange in train services as both the East London and the Thameslink services serve it. Apart from minor renovations and restorations the actual building had never been altered, becoming a protected heritage site. However, because of the unprecedented popularity of the Thameslink and East London Services the station could not cope with the daily influx of passengers and is now scheduled for regeneration in 2019. I chose this site for my research because it is a location intrinsic to Peckham, used by hundreds daily on their journeys to and from work.
Site 3-Queens Road Peckham
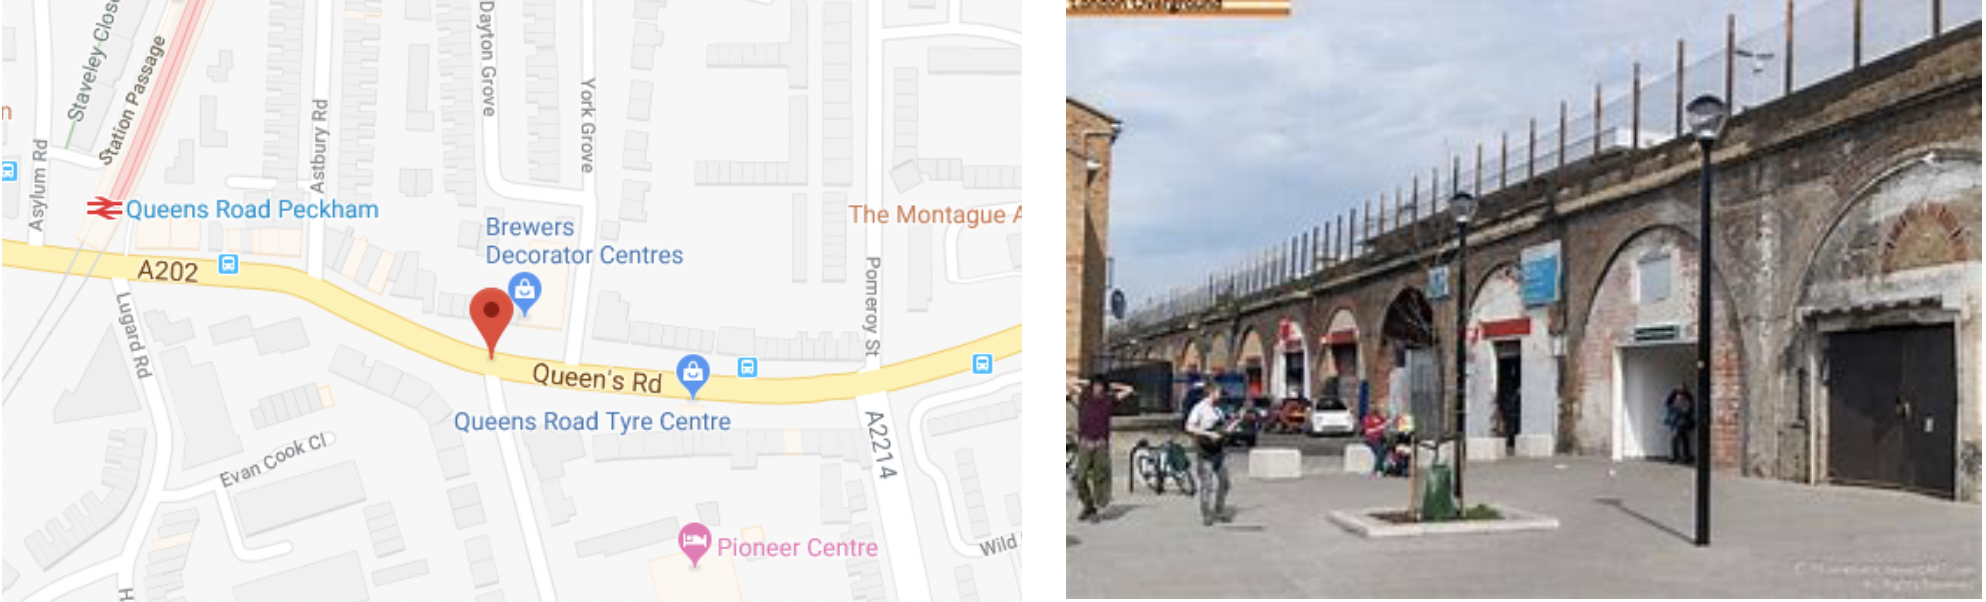
Queens Road Peckham – renamed after Queen Victoria, is not only home to the train station opened in 1866, but is also part of the A202, a primary A road connecting London with the Dover port. This was an important route connecting London by sea trade to Continental Europe. As both the route and the station had been constructed in the 1800s, the area quickly became known for import and business.
Queens Road Peckham – renamed after Queen Victoria, is not only home to the train station opened in 1866, but is also part of the A202, a primary A road connecting London with the Dover port. This was an important route connecting London by sea trade to Continental Europe. As both the route and the station had been constructed in the 1800s, the area quickly became known for import and business.
Research Methods: Resources:
The research methods I have chosen are a mixture of comparative environmental quality surveys and qualitative data collection methods; such as group interviews. This enables me to have a mix of physical data and attitudinal information, which helps me better quantify the effects of gentrification. As my secondary data I have used; census data from the 2001 and 2011 Census, Metropolitan police databases, alongside various articles to support or contradict my analysis and interpretation. I conducted my data collection throughout September and October 2018.
Index of Burglarability Pen, Paper
This is a quantitative assessment of how susceptible a home or business is to crime and/or robbery. This is measured by rating each property a -1 (absent) or +1 (present) on features like burglar alarms, door locks etc. I travelled to each site on the 10thof October 2018 and gathered results from both the sites and areas surrounding them. This method is important because one of the aims of gentrification is to renovate and improve an area; which includes reducing crime rates. In comparing the index between sites, I can analyse differences in higher and lower income areas and decide if gentrification has been successful.
Temporal Site Description Google Street View, Camera
This is a qualitative method that uses a mix of primary and secondary data. On October the 20th 2018, I travelled to each site and took multiple photos to compare with past Google Map images. In order to achieve the best comparison photos, I took multiple photos of each site at various times of day and at multiple angles. I used Google Maps to obtain pictures of Peckham at different points in the last 10-12 years as their technology allows me to make temporal comparisons. In utilising technology like google maps it allows me to understand how gentrification has increased and where the most gentrification is occurring spatially over time.
Building Decay Index Pen, Paper
This is another quantitative data collection method in which we measure housing conditions around a given area. Decay can be measured in several categories e.g. peeling paint and graffiti, this should help indicate any economic and social inequalities in an area, such as council estates being run down, and poorly constructed, while private let homes in more affluent areas are of higher standard. I also conducted this method at the three sites on October 10th, 2018. It requires an in-depth assessment of each site in order to come to a result, as there might be certain areas of each site that are in more decay than others. Although one downside of this method is that some residents might object to their house being recorded or used in research.
Mental Mapping Map, Colour Pens
Mental mapping is a qualitative data collection method in which respondents can colour in a base map of areas where they feel least to most safe (red being least safe, green being most), or other behavioural habits about the area (where they visit the most). In doing this respondent data can be further divided into gender, age, and ethnicities, which can highlight any differences in certain demographic groups, e.g. an age group frequenting a leisure centre more than their seniors. This also allows discussion into changes in an area, and how different demographics can perceive the same area. A potential issue in collecting data might be that it is too time-consuming for most participants. I carried out this method (on 13th October 2018) in a workshop within Peckham Levels; a creative workspace and cultural destination enabled by the gentrification of Peckham itself. There I led a discussion on gentrification with invited and walk-in guests and asked them to write on a large map of Peckham. They answered where they felt most safe, where they visited the most, and places that held significant memories for them.


Questionnaire Pen, Paper
A questionnaire is a data collection method in which respondents answer a set of concise written questions, this can include both quantitative or qualitative questions, and open or closed questions. An advantage of this method is that it is a quick, straightforward way to gain a lot of attitudinal and personal information on people’s perceptions of an area, their habits, experiences, and any other relevant information. Although one difficulty in collecting data with this method is that there might be a lack of understanding about certain questions causing some respondents to skip questions or hastily answer. This can in turn affect any data collected and decrease the reliability of results. In my questionnaires, question 1-5 asked background information about demography, ethnicity, age, and areas of residence. This data was collected on several excursions in and around Peckham from the 15th-23rdof October 2018. I collected questionnaire responses from 60 people who either; live in Peckham, live near Peckham, and those who live further away. This made data conversion easier and allowed me to use both percentages and set values in my data presentation.
Group Interview Recorder, Pen, Paper
A group interview is a qualitative data method in which a group of participants (usually 3-8) are asked a set of questions around a topic, this method is helpful because its less time consuming than individual interviews and uses utilises open questions to allow more personal and relevant responses. My group interview was conducted inside a workshop in Peckham levels; a site made available through the gentrification of Peckham, on the 17thof October 2018. I had 4 young non-resident participants engage in a conversation about gentrification; the physical meaning and the current consequences of this process in Peckham. The conversation began with gentrification as a general concept and whether they viewed the process as positive or negative, we then explored perceptions of Peckham because of ongoing gentrification. However, a disadvantage of using this method was that results are hard to quantify and present.
Census Data National Statistics, Census
To be able to temporally compare Peckham in various stages of its gentrification I will need to use both qualitative and quantitative secondary data. To enable this, I used statistics from the 2001 and 2011 census regarding the parliamentary constituencies of Peckham and Camberwell. This will allow me to compare not only population statistics, but ethnic minorities, employment rates, and migration across a decade within Peckham.Although a disadvantage of this technique is that data might be from a wider area ,such as Southwark or Peckham and Camberwell instead of being exclusivly Peckham.
Data Presentation Results;Has the gentrification of Peckham led to improvements in the built environment?
Gentrification generally aims to totally restore and improve an area; this includes improving factors such as crime, education, and built environment which is generally found to be lacking in areas of depravation. In this section I aim to find out whether the gentrification of Peckham has led to improvements to the built environment and aesthetics of Peckham. To answer this sub-question, I used methods such as the Building Decay Index, Temporal Site Descriptions, and some questionnaire data to analyse perceptions of the built environment in Peckham. I expect that gentrification has improved the built environment and aesthetics of Peckham to some extent but that there are still signs of decay and deprivation, and that perceptions of the built environment were quite positive. I also presume that areas surrounding train stations will have larger improvements in built environment as that is where most visitors come through.
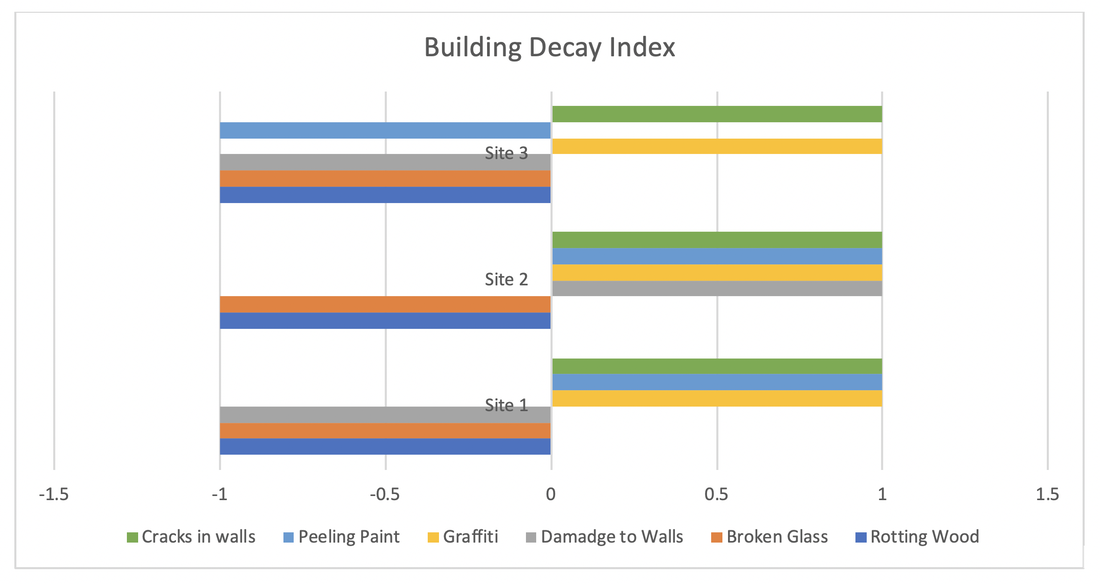
The data from the building decay index in Peckham shows that there are some signs of decay at every site, despite gentrification dated buildings are still in use, and full-scale building regeneration is needed. At all sites there were no signs of rotten wood, or shattered glass, which suggests that some renovation has occurred to make the area seam less in decline. At site 1, there were three out of six signs of decay present. In site 1 itself and the buildings (both commercial and residential) surrounding it there was evidence of graffiti, peeling paint and damage to walls. Signs of decay like graffiti could be the result of antisocial behaviour from local youth, while more physical decay comes from years of disuse and neglect. This is most likely from the inattention of the council to public services and some council owned residences. At Site 2 there were no visible signs of decay apart from peeling paint, however in the buildings around site 2, such as the leisure centre there were other signs such as graffiti, and cracks in walls. At site 3 there is the least amount of building decay, with minimal graffiti and cracks in walls in around the site, this suggests that more income has been invested into the appearance of the area then there has been at site 1 and site 2. This data shows that gentrification has not totally improved built environment around the key sites but has instead partially renovated drastic signs of decay such as broken glass to seem more appealing to those who journey through.
This data suggests that a vague effort has been made to improve the built environment of Peckham and lessen signs of decay. At some sites such as site 3, decay is almost non-existent, suggesting more resources have been directed there than the other sites, this could be because of a higher target demographic at site 3, or that the more visitors pass through. This partial regeneration has led to stark contrasts between the sites such as those between site 1 and 3. This could be the result of market-led gentrification where the main stakeholders are private developers and business owners rather than the government.
This data suggests that a vague effort has been made to improve the built environment of Peckham and lessen signs of decay. At some sites such as site 3, decay is almost non-existent, suggesting more resources have been directed there than the other sites, this could be because of a higher target demographic at site 3, or that the more visitors pass through. This partial regeneration has led to stark contrasts between the sites such as those between site 1 and 3. This could be the result of market-led gentrification where the main stakeholders are private developers and business owners rather than the government.
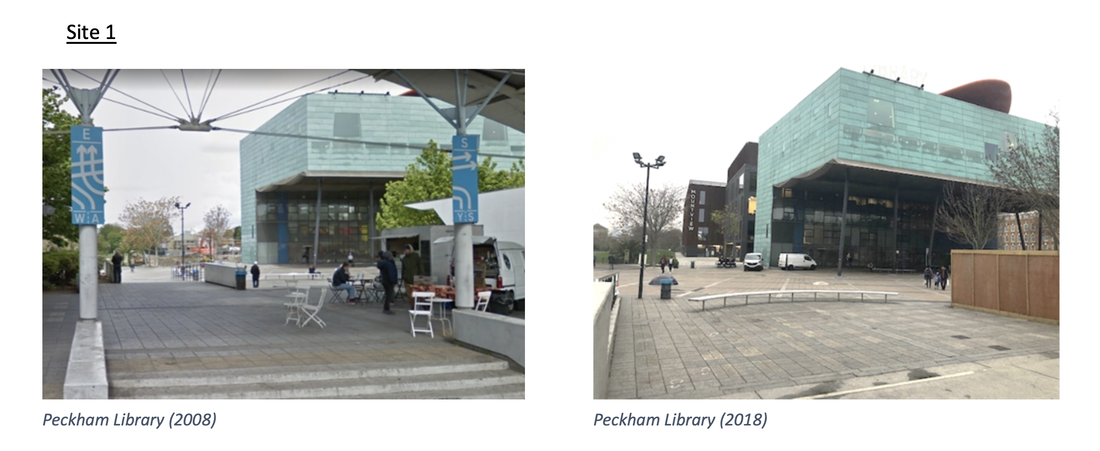
The first temporal comparison is of Site 1 between 2008 and 2018; built by Sterling Prize winners Alsop and Stormer,it is arguably the site of flagship development in Peckham, which led to more investment and income being directed into the area. The first picture shows Site 1 8 years after its constuction, and there are quite a few people visible, either walking thorugh the pathway that connects north and central peckham, or customers at a food van under the canopy. The area behind the library is a storage site, part of a Whittam’s Timber Yard. In 2018 we can see signs of wear on the buulding itself; some discolouring on the tiles possibly from chemical erosion of rain, we can also see a construction site to the right of the building. This small space is currently being renovated and will probably become a consumer service; such as a restaurant or café. However, also in the ten years, the lot behind the library has been bought by the Southwark council, and the construction of Mountview Park Dance school began, a leading academy in drama. This new building boasts a public foyer with two cafes, a rooftop restaurant, 200 seat theatre and both community and office spaces to rent. The multifaceted building was built by Sterling Prize winner Gilbert-Ash and was funded by Southwark Council, the University of East Anglia, the Alliance of Musical Theatre Conservatories, and Trinity College London[i]. For the Southwark council, this investment was likely seen as a way to take advantage of a new cultural destination, and make it widely accesible to diffrent demographics; such as creative students and aspiring actors. It’s multi-functional purpose also allows more potential income to be generated- either from the public consumer aspect of the building , or the private studio spaces for actors and drama students. As such, Peckham Library and Mountview Academy are now two adjacent buildings, both buit by Sterling Prize winners; albeit 18 years apart. In conclusion, this data supports that gentrification is improving the built environment of Peckham, through modernising old brownfield sites and creating new community spaces.
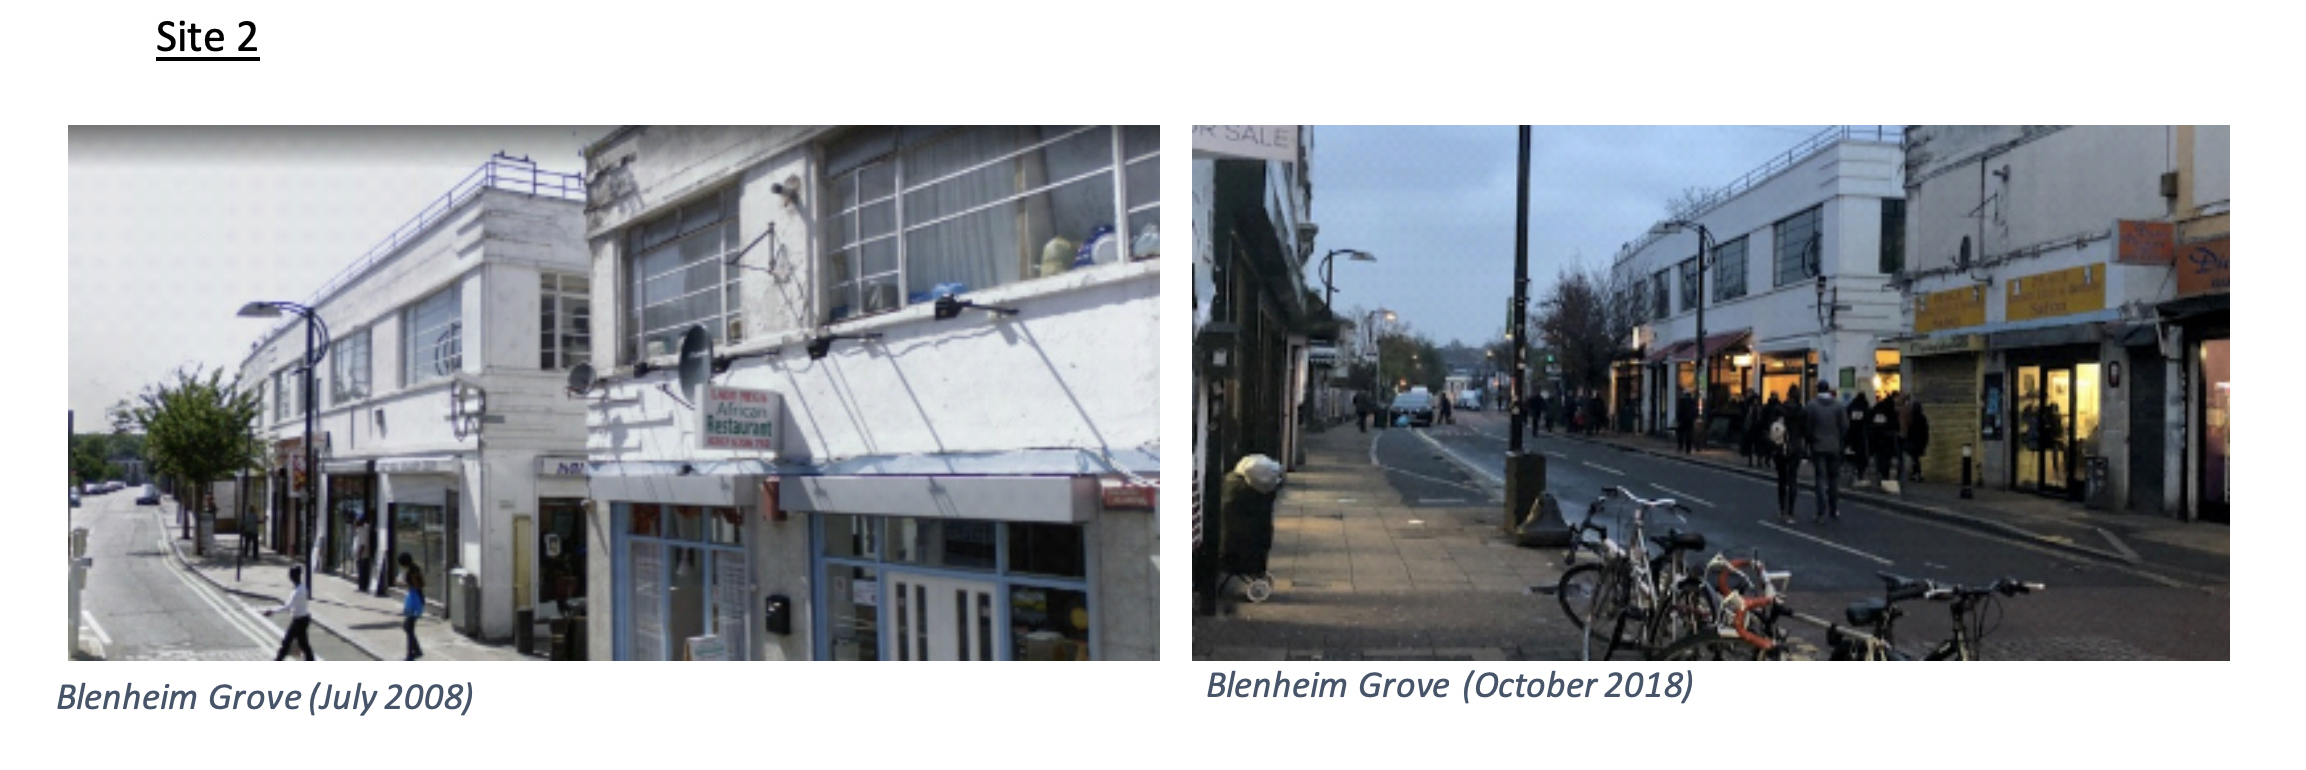
These two pictures show the ten-year time difference in Blenheim Grove, Peckham; the east entrance to Site 2. In 2008, the two buildings on either side of the station entrance were recently built, and the area recently decorated with palm trees and new retro lighting-an effort to improve the appearance of the area. The shops on the ground floor of each building were hair shops. There were few visible customers for either business, or users of the train station. However, in 2018, there is a substantially higher number of people around the station and the surrounding shops. This shows there is more people using the station, and more income being spent in the surrounding shops. The building to the left of the entrance has been maintained in terms of appearance with a new coat of paint and updated windows, while the hair shop below has been displaced by a trendier café. This is also the case for many commercial spaces in Peckham; shops of cultural significance like hair-shops and ethnic restaurants are being displaced by generic cafes and restaurants.
This change has been apparent to both residents and visitors as stated by one of the participants of the group interview. “[…] the amount of hair-shops has decreased and now there are more hipster cafes.” In contrast the building on the right has fell into a state of disrepair; its windows have been boarded up, while the paint has become more cracked. Visually the building is a more aesthetically unpleasant than its neighbour and shows how market-led regeneration creates stark contrasts in an area. This data supports that the gentrification of Peckham has led to some improvement in the built environment; mostly through minimal maintenance and restoration work, this data also shows that the gentrification of Peckham has been less about physical gentrification as seen in areas such as Stratford, but has been more about restoring old spaces and rebranding them to reach wealthier target groups such as the Bussey building and Peckham levels.
This change has been apparent to both residents and visitors as stated by one of the participants of the group interview. “[…] the amount of hair-shops has decreased and now there are more hipster cafes.” In contrast the building on the right has fell into a state of disrepair; its windows have been boarded up, while the paint has become more cracked. Visually the building is a more aesthetically unpleasant than its neighbour and shows how market-led regeneration creates stark contrasts in an area. This data supports that the gentrification of Peckham has led to some improvement in the built environment; mostly through minimal maintenance and restoration work, this data also shows that the gentrification of Peckham has been less about physical gentrification as seen in areas such as Stratford, but has been more about restoring old spaces and rebranding them to reach wealthier target groups such as the Bussey building and Peckham levels.
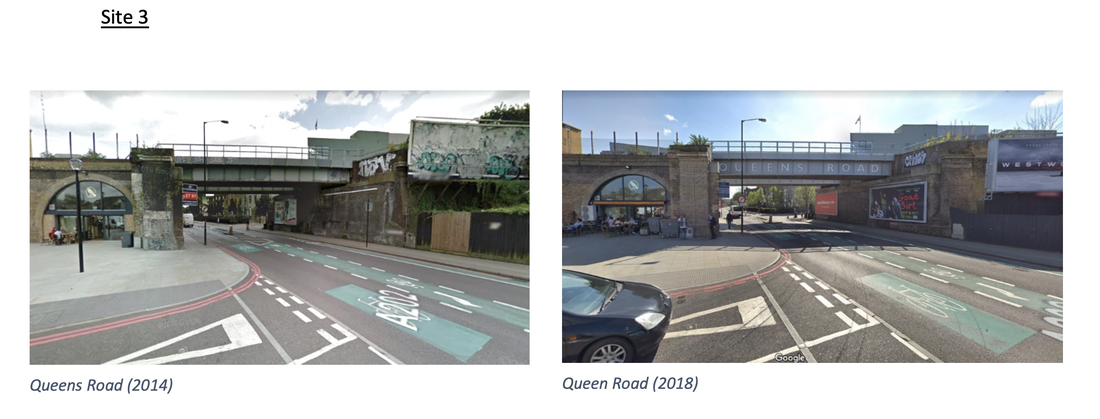
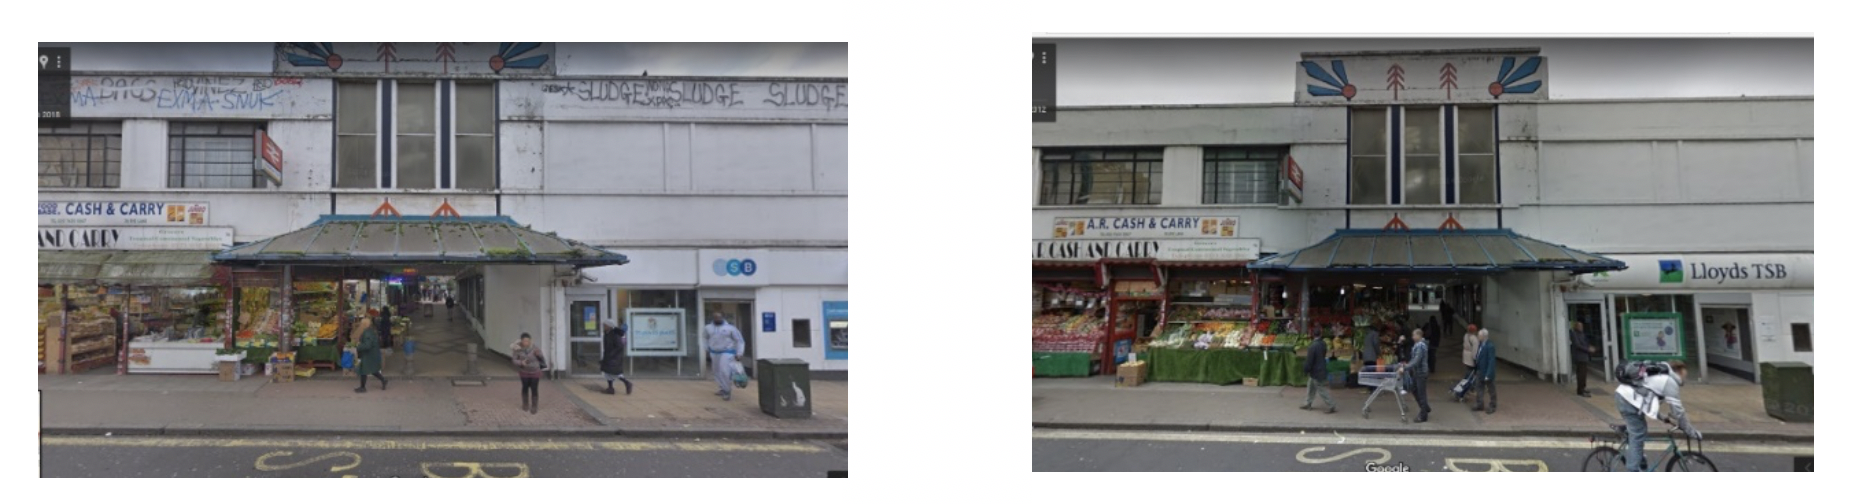
These two pictures show a similar time comparison at Queens Road Peckham between 2014 and 2018. Asylum road is not only the location of Queen Road station but an essential A road which joins London to Denver, often used for trade transport, and has thousands of drivers pass through daily to Deptford and Leiwsham. The first picture shows substantial graffiti covering the east side of the bridge and the wall connecting it, an old disused billboard, and a neglected unkempt fence on far side of road. There is mold evident on the bricks above the café, and the area is in an apparent state of deterioration. The second pictue, taken four years later, shows the bricks in the archway have been thourughly cleansed to look newer, and the bridge itself has been repainted and has had a LED sign installed.
The large billboard overlooking the road has been restored, and another has been added in the walkway, this suggests that advertisers are intrested enough to publicise to the high numbers of people that travel through the road, despite numerous billboards nearby. The graffiti covering the archway appears to have been removed but it has quickly been replaced by another, which shows that despite restoration vandillism by youth is still occuring. Through this temporal comparison it is apparent that large efforts have been made by the local government to improve the built environment. This was most likely a municipal decision to create a more attractive appearance to the area for passerbys and visitors to the area. Visual data for Site 3 supports the argument that there have been improvements in aesthtetics through cleaning and removing old grafiti, repainting areas and adding greenary.
The large billboard overlooking the road has been restored, and another has been added in the walkway, this suggests that advertisers are intrested enough to publicise to the high numbers of people that travel through the road, despite numerous billboards nearby. The graffiti covering the archway appears to have been removed but it has quickly been replaced by another, which shows that despite restoration vandillism by youth is still occuring. Through this temporal comparison it is apparent that large efforts have been made by the local government to improve the built environment. This was most likely a municipal decision to create a more attractive appearance to the area for passerbys and visitors to the area. Visual data for Site 3 supports the argument that there have been improvements in aesthtetics through cleaning and removing old grafiti, repainting areas and adding greenary.
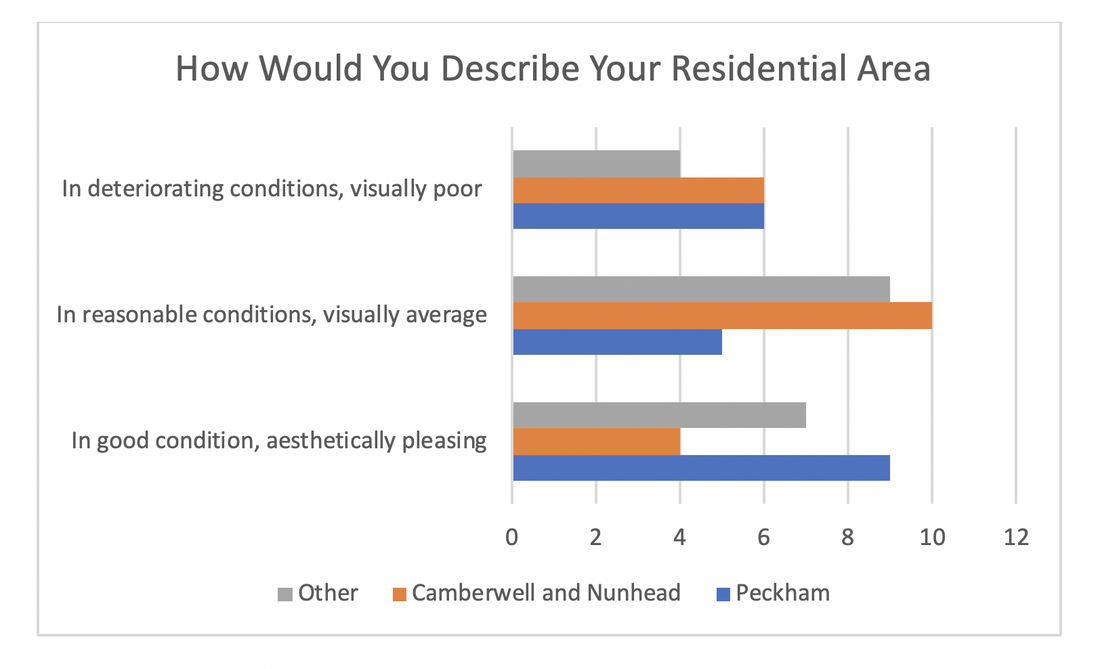
This data shows how people rated their residential conditions, either of their house or wider residential neighbourhoods. The graph shows that most people rate their housing conditions as ‘in reasonable condition’; of those who stated this, 10 were from Camberwell, and Nunhead, 9 from elsewhere, and 5 from Peckham. Of the people who rated their residential area as aesthetically pleasing, 9 were from Peckham, 4 were from Camberwell, while 7 were from elsewhere in London. This could be a result of recent gentrification in Peckham improving housing conditions. Although residents who described their living areas as deteriorating were from all three stated areas; more of them were either from Peckham, or Camberwell and Nunhead than elsewhere. A geographical theory on gentrification states that rising property prices invariably accompany gentrification; forcing poorer residents out who cannot afford the price of goods and services. This is occurring to some extent in Peckham; rent prices increase forcing residents to stay in rundown residential neighbourhoods because they do not have the income to move elsewhere. “When the cost of housing inflates faster than wages those with low incomes find themselves excluded from the housing markets”[i]
In addition, some residential neighbourhoods are being demolished to make way for more profitable expenditures, this forcibly removes long-time Peckham residents and disrupts their lives, causing them to have to seek housing in other boroughs or end up in temporary housing. Both options are equally unfavourable to families, as new schools, and jobs closer to their new house will have to be found, and housing waiting lists often have year long wait before suitable housing is found. The difference in opinion between Peckham residents could be because of be the housing contrasts between long term residents and newer ones in Peckham. As younger, wealthier residents move into newer housing in central Peckham- which are visually pleasing, while more long-term residents do not have the income to move into any housing of their choosing and instead must stick to cheaper housing. Overall, it shows that gentrification has improved the built environment in Peckham, but it has occurred significantly more in wealthier areas.
Has the gentrification of Peckham led to improvements in crime and social inequalities?
Through gentrification, social and economic inequalities are expected to lessen as more income is brought into the area, such as incidences of crime and housing. However, the practicality of this change often creates more inequalities between new wealthier residents and existing residents. In this sub-question, I seek to find out if and how gentrification has affected crime in Peckham and explore the underlying social significance. In order to do this, I have used methods such as the Burglarability index, and incorporated both questionnaire data, articles, and secondary data from the Metropolitan Police Database to provide more insight.
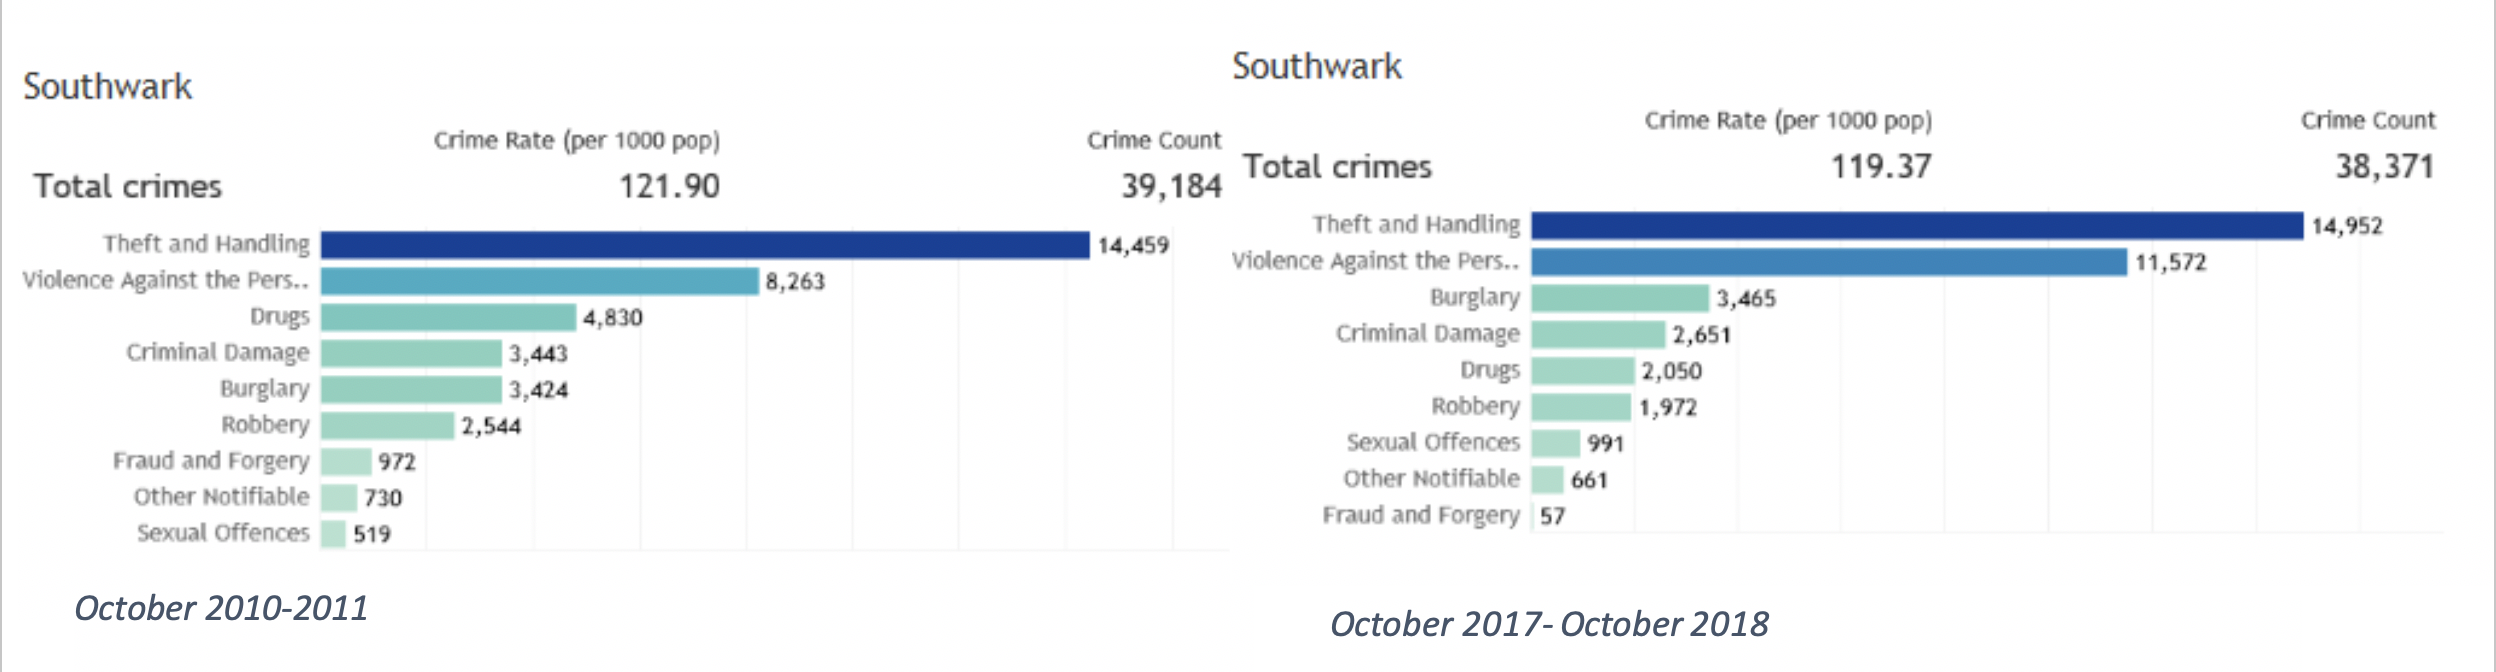
These two graphs compare crime rates and counts in the borough of Southwark between October 2010 and October 2018. While the rates of crime have only changed marginally in the 6-year period, the types of crime committed have changed drastically. In the first graph, theft and handling was the highest type of crime committed in Southwark, with over 14,400 counts in the span of the year- which was almost twice the number of the next most common crime. In 2018 this increased by over 400 counts. The next category of crime committed is violence against the person; this is defined as direct physical harm or force being applied to another person[i].Between October 2010 and October 2011, violence against the person was the second most common crime committed at just over 8,000 counts, this drastically increased in the span of 6 years to 11,000 counts. In Peckham alone, there were 1,590 counts of violent crime. However, the increased rates of crime in some categories can be a result of more security cameras, and reports being made, this is applicable to crimes such as sexual offences, and fraud and forgery.
In August 2011, a series of riots broke out across London in the wake of a young man’s death in Tottenham, North London, “the rioters came predominantly from disadvantaged communities, they were angry at the way things were and many had experienced a hostile relationship with the police. In the wake of the shooting of Mark Duggan – the flashpoint that ignited the riot – this anger exploded into days of rage.”[ii]This is a crucial factor behind the high rates of criminal damage, burglary and robbery seen in the first graph (over 2,000 counts each), which all have since decreased in the 6 years following the riots. Despite the event lasting less than a week over 300 million pounds of loss and damaged was recorded by the Metropolitan police. This was partly enabled by the high numbers of youth who took to the streets to protest (over 14,000 young people), despite the focus of the event being in Hackney and Tottenham, the aftermath was felt across the capital. Residents of Peckham saw substantial damage to buildings in Peckham Rye, and one shop-front was entirely burnt down.
An article by Gary Becker suggests that income inequality is an influential factor in high crime rates, areas where there is a high-income gap between the working class and upper middle class would also have higher crime rates. This is partly explained by the fact that in areas of high income gaps those with low disposable incomes and those in poverty are more exposed to affluence and wealth, and for some this becomes a pull factor to commit crimes; would-be criminals make a cost-benefit assessment of the likely rewards from breaking the law against the probability of being caught and punished[iii]. The UK has a relatively higher level of income inequality compared to other ACs (5thin Europe)[iv].This theory supports the data shown in the graphs; as gentrification is considered a process which increases income inequality it can then be considered a process that increases crime rates; counts of violence and theft and handling in Peckham have steadily increased over the last few years. This data contradicts the idea that gentrification has led to improvements in crime and safety in Peckham, instead data supports that gentrification might have worsened crime rates through increased income inequality.


This Burglarability Index shows that all residential homes at every site have burglar alarms, which suggests all homeowners and residents have taken some steps to reinforce their homes against burglary. Site 1 has the highest Buglarability index which shows that it is the most protected against crime out of all the sites. Site 1 utilises window locks, metal shutters, burger alarms and more to prevent crime, and identify those who commit them. The numerous crime prevention technologies at this site imply that more income and resources have been invested by the local government (Southwark Council) in reducing crime in this area, than site 2 and 3. While site 2 scores the lowest on the Burglarability index and is the most vulnerable to crime, it is the only site to have a neighbourhood watch, this suggests there is a stronger sense of community against crime in this area despite lack of municipal funding/attention. There are no metal bars on windows at any of the three sites; this suggests that crime is not as prevalent to the extent that crime prevention becomes more important than maintaining a pleasant aesthetic for visitors. Site 3 is arguably the site most holistically gentrified in the last decade. Contrary to its almost complete gentrification, site 3 does not have many crime prevention technologies, this could suggest that crime rates are quite low in that area and excessive preventive measures are not necessary.
On the other hand, site 3 supports the sociological theory of the Broken Window [i];visible signs of crime, anti-social behavior and disorder can create an environment that enables further crime and vice-versa. This would suggest that as Site 3 has the most improved built environment, it has created an environment that psychologically deters crime and therefore requires less crime prevention. Despite the different preventive methods of deterring crime used across Peckham, there have been 168 counts of Burglary in 2018[ii]. In conclusion the data from the Burglarability Index shows that gentrification has not holistically improved crime and safety across Peckham, but more selectively directed resources into areas of more importance, such as site 3.
On the other hand, site 3 supports the sociological theory of the Broken Window [i];visible signs of crime, anti-social behavior and disorder can create an environment that enables further crime and vice-versa. This would suggest that as Site 3 has the most improved built environment, it has created an environment that psychologically deters crime and therefore requires less crime prevention. Despite the different preventive methods of deterring crime used across Peckham, there have been 168 counts of Burglary in 2018[ii]. In conclusion the data from the Burglarability Index shows that gentrification has not holistically improved crime and safety across Peckham, but more selectively directed resources into areas of more importance, such as site 3.
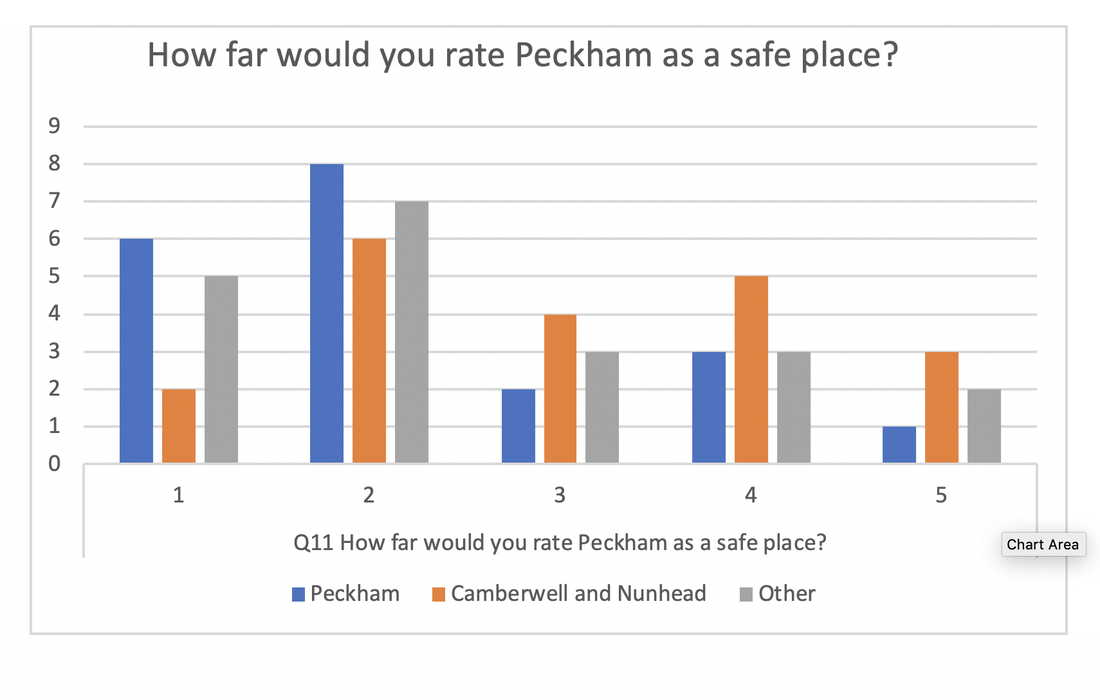
The graph above shows that most of the respondents to this question have rated Peckham as low on the scale of safety to some extent, 34 people combined have rated it as 1 or 2. Of those who rated Peckham as unsafe, the majority of were from Peckham themselves. While a close second were those from elsewhere in London. From this data set, residents from Camberwell were the most evenly spread in their answers, with a slight majority leaning towards the unsafe half of the scale. 17 people rated Peckham as a safe place to some extent, of these 17; 4 were from Peckham, while 8 were from Camberwell and Nunhead. A factor which largely influences people’s perception of crime in Peckham is media, through both informal and formal sources. Peckham has often been the infamous centre of attention for over two decades in matters such as stabbings and gang-related violence. Informal place representation often tends to portray Peckham as a dichotomy of either a ‘up and coming’, diverse area or a dangerous, crime ridden place. As such, Peckham connotates an idea of an unsafe place in many people across London, and this is only heightened by slandering articles published by media sites.
This quote is from an article written by the Telegraph in 2005 regarding Peckham residents. “They may live there, or sell crack cocaine there, or be shot dead there, but they don't go for days out there”[i]. The substantially large media influence on place perception explains why most people from elsewhere in London, rated the area poorly. However, this is not to be linked to residents’ view of Peckham, as they will have seen both the crimes committed here and the keen sense of community felt in the area. As such most respondents who rated safety between 2 and 4 did so because they thought safety was improving steadily in the area. In summary, the majority of respondents have rated Peckham as unsafe, as a result of both individual place perception and place representation in media.
This quote is from an article written by the Telegraph in 2005 regarding Peckham residents. “They may live there, or sell crack cocaine there, or be shot dead there, but they don't go for days out there”[i]. The substantially large media influence on place perception explains why most people from elsewhere in London, rated the area poorly. However, this is not to be linked to residents’ view of Peckham, as they will have seen both the crimes committed here and the keen sense of community felt in the area. As such most respondents who rated safety between 2 and 4 did so because they thought safety was improving steadily in the area. In summary, the majority of respondents have rated Peckham as unsafe, as a result of both individual place perception and place representation in media.


This graph is from questionnaire data regarding perceptions of crime in Peckham, most respondents to this question were certain that crime in Peckham had changed but were mixed as to whether it has decreased or increased. 17 respondents; of whom 6 were from Peckham, rated that crime had stayed the same; this perception corresponds with data from the Metropolitan Police, showing that counts of crime have stayed relatively similar for over 5 years.
21 respondents believe that crime in Peckham has increased, of those 21; 9 were from Peckham, 7 from Camberwell and Nunhead, and 5 from elsewhere in London. This perception is rational, as the average age in Peckham is 30 years old[i], most will have few memories of the late 1970s and early 1990s where gang related crime was at its worst in south London, particularly Peckham, and will thus a less severe perception of crime in Peckham, than those who lived through the crime epidemics of the 1980-90s. Peckham still has a bad place representation that can be traced back to the 1980’s; when high unemployment and a lack of economic opportunities for residents led to the areas decline and notoriety as one of the most deprived in Western Europe.[ii]Gang rivalries in Peckham also often had civilian casualties, which only increased scepticism and bad representation for the area.
Lastly, 22 respondents believe that crime in Peckham has decreased to some extent, majority of those who chose this were from elsewhere in London. Visitors of Peckham will have better perceptions of crime because they do not see the full extent of crime occurring in an area, and so have less negative experiences on which to base their perception on. One participant of the group interview believes crime to have decreased in the area as “criminals are being deterred from blatantly committing crimes”, this is a viewpoint similar to the 22 respondents who believe crime in Peckham to have decreased. Criminals might be being discouraged from ‘blatantly committing crimes’ as a result of increased surveillance and burglar alarms at some sites (as seen in the Burglarability index). There is an even amount of people who think crime has decreased and increased in Peckham, while over 15 people think it has stayed the same. In summary, resident and non-resident perceptions of crime in Peckham are generally mixed, primarily due to factors that affect place perceptions such as age, area of residence and informal place representation.
Conclusion
Globally, gentrification is a controversial (often contested) process that has led to debates in both politics and urban-planning. Although it adds more income to an area, it also takes away social capital and diversity. This investigation provides an insight into the process, the changes it brings to a community and how it affects inequalities and perceptions of a previously deprived area.
Has the gentrification of Peckham led to improvements in the built environment?
The process of gentrification has led to vast improvements in the built environment of Peckham at some sites. This is supported by evidence from the temporal site descriptions; which show that both site 3 and site 2 have had considerable changes in aesthetic within the last five to ten years. However, this has created contrasts between sites within Peckham as shown in the building decay survey, which has consequently resulted in a change of character to the area. More culturally important shops like hair shops, and those selling African cuisine are being displaced by generic cafes and restaurants. Simultaneously, different demographics are being introduced to the area through development; such as students and actors from the new Mountview Academy.
Although, questionnaire data suggests that improvements in the built environment of residential areas has contributed to housing inequalities. Newer buildings are often synonymous with higher rent across London. In order to improve the built environment of Peckham, some deteriorated residential housings were demolished to make way for newer buildings, which displaced some previous residents while the remaining residents were often forced to relocate elsewhere because of rising rent prices.
Has the gentrification of Peckham led to improvements in crime and social inequalities?
Through gentrification, inequalities are expected to lessen as more income is invested into an area. However, the practicality of this change often creates more inequalities between residents with high disposable incomes and low disposable incomes.
Secondary data suggests that gentrification has not decreased crime in Peckham, but instead fed into a larger positive feedback system. This is supported by data from the MET database which suggests that counts of crime such as theft and violence against the person have steadily increased as a direct outcome of increased gentrification in the area. Which is in turn a result of increased income inequality in the area. The data from the Burglarability index shows that more income has been directed at preventing crime at specific sites, rather than equally across Peckham. This suggests that gentrification has not holistically improved crime and safety across Peckham, but more selectively directed resources into sites of more importance and revenue. Questionnaire data shows that perceptions of crime and safety in Peckham are mixed despite recent gentrification.
The gentrification of Peckham has been partially successful, conclusions from both sub-questions show that any change brought to the area has been selective. Whilst built environment has been improved, it has only been drastically improved at site 3. This has in turn only contributed to contrasts and inequalities in Peckham in income, and housing. Data from the Burglarability index shows that crime prevention measures in Peckham only occurred at some sites, and overall data supports the idea that gentrification has increased crime in Peckham to some extent.
Evaluation
This investigation into the gentrification of Peckham, and its subsequent effects on the local community, has been mostly successful. However, there are some aspects of the investigation such as data collection and methods which can be improved to display data with a higher level of validity and reliability. There are clear aims and sub-questions which show an empirical approach to both the methods and data collection of the investigation, which makes the investigation more thorough and easier to understand/analyse.
In this investigation I have used both qualitative and quantitative data collection methods in order to have balanced foundations to use in data analysis and interpretation. Some methods had disadvantages that made data collection more difficult, such as the Building Decay index as some residents might have had privacy concerns to their house being used in research, and the group interview; of which results were time-costly to play back and record.
For data collection of the questionnaire, a pilot study of ten was conducted (see appendix) in order to select an appropriate characteristic to use in stratified sampling and decide sample size. I also used an online tool to further calculate a sample size representative to the population of Peckham; with a 10% error margin and a 90% confidence level the sample size was equated to 60. This means that there is only 10% chance that my questionnaire results are inaccurate and unrepresentative of the population. Other sampling methods used in the data collection were convenience sampling used in the group interviews and simple random sampling; used in conducting the pilot study and questionnaires, and convenience sampling at a walk-in event in Peckham Levels. I also had to make sure my investigation was ethical and aware of socio-political dimensions. This meant making sure everyone who participated in this investigation had the right to confidentiality, and privacy. I directed this by debriefing all respondents of the questionnaire to my research and what results would be used for, assuring them that all replies were anonymous.
Journals and articles referenced in this investigation were published by wider boards and panels, meaning any content sourced has likely undergone fact-checking and peer review, and is therefore reliable to an extent. Databases used such as census data and that of the MET police are also subject to a similar review. Therefore, the data sources used in this investigation have a high reliability. A disadvantage of using some databases like the MET, however, were that data came from wider sample areas such as Southwark, or larger constituencies which minimises the extent to which it is representative of Peckham.
While all conclusions and analysis are objective, one factor that could influence my interpretation of data is that I live in Peckham and therefore am biased against gentrification. To minimise bias in this investigation I have tried to be balanced in showcasing both the negatives and positives of gentrification. To improve the accuracy and reliability of my conclusion and analysis in the future, I would invite more non-resident, wealthier opinions into the discussion of gentrification in Peckham and the wider concept.
To improve the overall breadth of data, I would ideally have a larger timeframe in which to conduct data collection, and therefore have the ability to repeat collection and average results in my chosen location. It would be useful to compare what I have found in Peckham to gentrification that has taken place in other places in London such as Stratford or even to other cities in the UK such as Liverpool, Sheffield or Manchester.
Further Gentrification Explorations

1. The Changing Face of Peckham with Ria Addison Gayle, artist and yr. 9 fine art students
|

3. Debate cake with Ahamed Mansarey at the Launch event with students from Harris Girls Academy East Dulwich and the public
|
